Thursday, August 09, 2007

screen: The power of windowing, in an xterm!

Here is an amazing piece of software, called screen, that will get you on a high if you spend just 5 minutes at it, exploring it with the help of a nicely prepared tutorial (here). It came pre-installed with my Ubuntu 7.04 (Feisty), but can be easily downloaded and installed.

Some of the things it can do for you:
  1. Allow you to open 'virtual' terminal windows inside a single xterm: not gnome-terminal, not konsole, just plain and simple xterm!
    So you can open various screen-based applications without opening so many independent terminals. That helps avoid clutter in the taskbar as well as saves you the hassle of searching for a particular terminal window. Switching between each of those virtual terminals is extremely easy, by the way.

  2. It also lets you run applications and then close (not always, it is all as you wish) the window that spawned the application, without disrupting the progress of the spawned process. As good as, if not better than, nohup.
    This is the main reason that led me to discover this highly useful piece of software, that remains to be highly under-used and is in fact unknown to linux users at large. Sad, I say!

  3. Has it ever happened with you that you opened a set of terminals, started doing some work in each of them but you had to leave the place in the middle of your job and then login from another machine? How do you get back those terminals? VNC? But why waste so much bandwidth when the same can be done safely and easily using screen. It lets you start a session of 'virtual' terminals, each of them running any application (totally independent of other applications). Then, if you have to leave the current place, just inform screen about the same and all will be taken care of!

It can do a lot more things, like the ability to let you work collaboratively with someone else, the ability to name (and rename) terminals, the ability to monitor terminals for activity, and so on and so forth.

Here are some of my settings.
  1. ${HOME}/.screenrc:
    #change the hardstatus settings to give an window list at the bottom of the                                              
    #screen, with the time and date and with the current window highlighted
    startup_message off
    defscrollback 2048
    vbell off
    altscreen on
    hardstatus alwayslastline
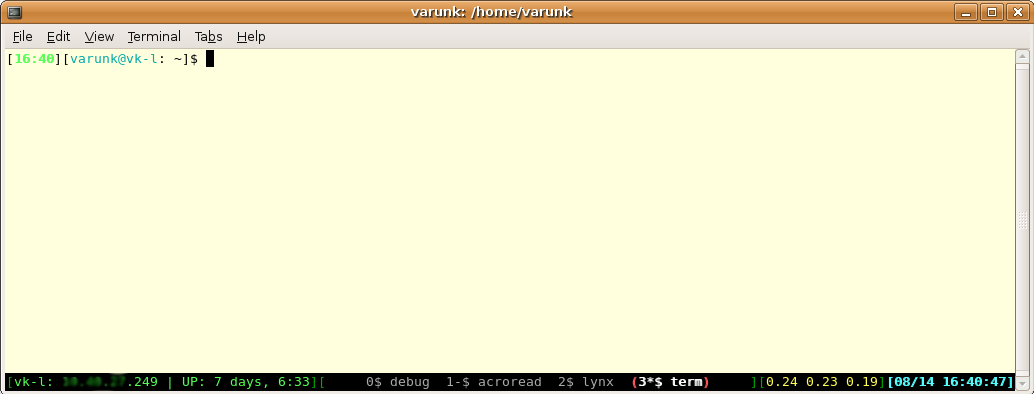
    backtick 1 60 60 /home/varunk/.screen_ip
    hardstatus string '%{gk}[%{G}%H: %1`%{g}][%= %{wk}%?%-Lw%?%{=b kR}(%{W}%n*%f %t%?(%u)%?%{=b kR})%{= kw}%?%+Lw%?%?%= %{g}][%{Y}
    shelltitle "$\ |term"
  2. ${HOME}/.screen_ip:
    #!/bin/bash
    # Script to get run by hardstatus in screen.
    # Prints customized single-line system stats
    IP=`ifconfig eth0 | grep Mask | cut -d: -f2 | cut -d " " -f1`
    UP=`uptime | awk -F' |,' '{print $4" "$5", "$8}'`
    echo -n "$IP | UP: $UP"
  3. Screenshot of my screen:
Give it a try and let me know if you do not like a thing about it.

Labels: , , , , , , ,

Saturday, December 16, 2006

Unix command in 'awk'

uname -a: Linux MyMachine01 2.4.21-37.ELsmp #1 SMP Wed Sep 7 13:32:18 EDT 2005 x86_64 unknown unknown GNU/Linux
i.e. Red Hat Enterprise Linux 3 running on AMD64. Shell: tcsh

Today's tip is about how to make awk run Unix commands on its input.

As it happened to me today, sometimes we want 'awk' to perform some UNIX command on some field in the input. I performed a Google search without much trouble but putting it here, nevertheless, would be a good idea.

So what I wanted to do was, look for a pattern in all the files in all the subdirectories in the current working directory (CWD) and if the pattern is present in the files, present the name of the directory which contains this file.

Let's say the pattern was: PaTtErN; and the directory structure:
Top/:
Top/Dir_1: Top/Dir_2: Top/Dir_3: Top/Dir_4 ...
Top/Dir_1/a.out Top/Dir_2/a.out Top/Dir_3/a.out ...
Top/Dir_1/b.out Top/Dir_2/b.out Top/Dir_3/b.out ...
Top/Dir_1/c.out Top/Dir_2/c.out Top/Dir_3/c.out ...


This is how I proceeded:
  1. Let's start with a simple grep command:
    grep PaTtErN Top/Dir_*/*
    The output of this command, for every line that matches in any of the files, is of the format:
    <FILENAME>:<MATCHING-LINE>
  2. Now let's extract the filenames from that list. Here comes the use of awk, to get a particular column:
    grep PaTtErN Top/Dir_*/* | awk -F':' '{print $1}'
    Print the 1st ($1) column of grep command's output, where each column is assumed to be separated by a ':'
    That's how we separate out the name of files containing the pattern we are searching for.

  3. The problem with this output is that in each directory, there could be multiple files which could possibly contain this pattern multiple times. However, what we really care about is the parent directory name, for example, Top/Dir_2.Here, I would introduce a lesser known but nevertheless, very useful command: dirname. I would also encourage you to look at the man page of another similar command: basename. These two come in really handy sometimes, as we'll see shortly.
    grep PaTtErN Top/Dir_*/* | awk -F':' '{print "dirname " $1 }' | sh
    That says, on the shell (sh), execute the command 'dirname <First-Column-Of-grep-Output>', which will give us the directory name of the file that contains the pattern.
    The problem is that it produces the directory name for each match in each file but we want it only once.

  4. No problem, that is taken care of by this:
    grep PaTtErN Top/Dir_*/* | awk -F':' '{print "dirname " $1 }' | sh | sort | uniq | less
  5. And lo, and behold, we have what we wanted.

Tip: It is always a good idea to less the output of a command, specially when you are not sure how big the output is going to be!

Labels: , ,

Friday, April 07, 2006

Valgrind - A GPL'd system for debugging and profiling

(Fedora Core 5 was used while issuing the commands listed in this post)
Valgrind is an award-winning suite of tools for debugging and profiling Linux programs. With the tools that come with Valgrind, you can automatically detect many memory management and threading bugs, avoiding hours of frustrating bug-hunting, making your programs more stable.

The Valgrind distribution currently includes three tools: a memory error detector, a cache (time) profiler and a heap (space) profiler. It runs on the following platforms: x86/Linux, AMD64/Linux, PPC32/Linux.

Valgrind's Tool Suite

The Valgrind distribution includes four useful debugging and profiling tools:
  • Memcheck
  • Cachegrind
  • Massif
  • Helgrind

Memcheck

Memcheck can detect if your program:
  • Accesses memory it shouldn't (areas not yet allocated, areas that have been freed, areas past the end of heap blocks, inaccessible areas of the stack)
  • Uses uninitialised values in dangerous ways.
  • Leaks memory.
  • Does bad frees of heap blocks (double frees, mismatched frees).
  • Passes overlapping source and destination memory blocks to memcpy() and related functions.
Memcheck reports these errors as soon as they occur, giving the source line number at which it occurred, and also a stack trace of the functions called to reach that line.

Cachegrind

Cachegrind is a cache profiler. It performs detailed simulation of the I1, D1 and L2 caches in your CPU and so can accurately pinpoint the sources of cache misses in your code. It identifies the number of cache misses, memory references and instructions executed for each line of source code, with per-function, per-module and whole-program summaries.

Massif

Massif is a heap profiler. It performs detailed heap profiling by taking regular snapshots of a program's heap. It produces a graph showing heap usage over time, including information about which parts of the program are responsible for the most memory allocations.

Helgrind

Helgrind is a thread debugger which finds data races in multithreaded programs. It looks for memory locations which are accessed by more than one (POSIX p-)thread, but for which no consistently used (pthread_mutex_) lock can be found. Such locations are indicative of missing synchronisation between threads, and could cause hard-to-find timing-dependent problems. It is useful for any program that uses pthreads. It is a somewhat experimental tool, so your feedback is especially welcome here.
So, just to see how this works, I wrote one of the smallest programs I have written:
int main () {
int *n, *p;
printf ("Before allocating first time\n");
n = (int*) malloc(4*sizeof(int));
printf ("After allocating first time\n");
p = (int*) malloc(4*sizeof(int));
printf ("After allocating final time\n");
}

and compiled it and ran with valgrind:
bash-3.1$ gcc Test.c
bash-3.1$ valgrind -v --leak-check=yes --show-reachable=yes ./a.out
...
--3119-- Arch and subarch: X86, x86-sse2
...
--3119-- REDIR: 0x8F0360 (rindex) redirected to 0x4005D60 (rindex)
--3119-- REDIR: 0x869820 (_dl_sysinfo_int80) redirected to 0xB002129F (???)
Before allocating first time
--3119-- REDIR: 0x8EBC08 (malloc) redirected to 0x4005177 (malloc)
After allocating first time
After allocating final time
--3119-- REDIR: 0x8ED3A4 (free) redirected to 0x4004DBF (free)
--3119-- REDIR: 0x8F11E0 (memset) redirected to 0x40061C0 (memset)
==3119==
==3119== ERROR SUMMARY: 0 errors from 0 contexts (suppressed: 12 from 1)
--3119--
--3119-- supp: 12 Fedora-Core-5-hack2
==3119== malloc/free: in use at exit: 32 bytes in 2 blocks.
==3119== malloc/free: 2 allocs, 0 frees, 32 bytes allocated.
==3119==
==3119== searching for pointers to 2 not-freed blocks.
==3119== checked 46,664 bytes.
==3119==
==3119== 16 bytes in 1 blocks are definitely lost in loss record 1 of 2
==3119== at 0x40051F9: malloc (vg_replace_malloc.c:149)
==3119== by 0x80483F7: main (in /home/kvarun/a.out)
==3119== 16 bytes in 1 blocks are definitely lost in loss record 2 of 2
==3119== at 0x40051F9: malloc (vg_replace_malloc.c:149)
==3119== by 0x80483DC: main (in /home/kvarun/a.out)
==3119==
==3119== LEAK SUMMARY:
==3119== definitely lost: 32 bytes in 2 blocks.
==3119== possibly lost: 0 bytes in 0 blocks.
==3119== still reachable: 0 bytes in 0 blocks.
==3119== suppressed: 0 bytes in 0 blocks.
...

Then, I compiled the program with -g flag on to give valgrind some more valuable information:
bash-3.1$ gcc Test.c -g
bash-3.1$ valgrind -v --leak-check=yes --show-reachable=yes ./a.out
...
--3180-- Arch and subarch: X86, x86-sse2
...
--3180-- REDIR: 0x8F0360 (rindex) redirected to 0x4005D60 (rindex)
--3180-- REDIR: 0x869820 (_dl_sysinfo_int80) redirected to 0xB002129F (???)
Before allocating first time
--3180-- REDIR: 0x8EBC08 (malloc) redirected to 0x4005177 (malloc)
After allocating first time
After allocating final time
--3180-- REDIR: 0x8ED3A4 (free) redirected to 0x4004DBF (free)
--3180-- REDIR: 0x8F11E0 (memset) redirected to 0x40061C0 (memset)
==3180==
==3180== ERROR SUMMARY: 0 errors from 0 contexts (suppressed: 12 from 1)
--3180--
--3180-- supp: 12 Fedora-Core-5-hack2
==3180== malloc/free: in use at exit: 32 bytes in 2 blocks.
==3180== malloc/free: 2 allocs, 0 frees, 32 bytes allocated.
==3180==
==3180== searching for pointers to 2 not-freed blocks.
==3180== checked 46,664 bytes.
==3180==
==3180== 16 bytes in 1 blocks are definitely lost in loss record 1 of 2
==3180== at 0x40051F9: malloc (vg_replace_malloc.c:149)
==3180== by 0x80483F7: main (Test.c:8)
==3180== 16 bytes in 1 blocks are definitely lost in loss record 2 of 2
==3180== at 0x40051F9: malloc (vg_replace_malloc.c:149)
==3180== by 0x80483DC: main (Test.c:6)
==3180==
==3180== LEAK SUMMARY:
==3180== definitely lost: 32 bytes in 2 blocks.
==3180== possibly lost: 0 bytes in 0 blocks.
==3180== still reachable: 0 bytes in 0 blocks.
==3180== suppressed: 0 bytes in 0 blocks.
...


A nice tool, it seems, it is. If anyone uses it and finds it useful, please let Ciju or me know, we'll put it here with acknowledgement. Thanks to Mausoom and Surendra for telling me about this interesting and useful tool.

Labels: , ,